Frequency-Response Analysis of
FLUKE® 368 FC Leakage Clamp Meter
BENCHNOTES BN2020-1

Figure 1. FLUKE® 368 FC Clamp Meter measuring 0.050 A (50 mA) WAVEGEN test current @ 60 Hz.
Area Focus
BUILDERA BENCHNOTES™ BN2020-1 documents the frequency and transient response of the FLUKE® 368 FC Leakage Clamp Meter for use in AC leakage-current measurements.
Background of Investigation
BUILDERA investigated the use of an AC clamp meter for ground leakage-current tests of portable equipment in accordance with UL 101 and UL 778, such as sump pumps for residential and commercial use. To better understand the frequency response and transient performance of the FLUKE® 368 FC, BUILDERA conducted multiple laboratory tests in a controlled environment.
Test Setup
The test set up included the following equipment:
Device Under Test (“DUT”)
FLUKE® 368 FC AC Leakage Current Clamp Meter
FLUKE CONNECT® mobile app software
Supporting Test and Measurement Equipment
KEYSIGHT® 33622A Waveform Generator (“WAVEGEN”)
KEYSIGHT® U1273A Digital Multimeter (“DMM”)
KEYSIGHT® Meter Logger mobile app software
IET® RCS-500 R-C substitution box (set to 50 Ω)
POMONA® BNC to 4 mm Banana adaptors and banana cables
BUILDERA™ custom x1 and x10 copper-wire current loop
Instrument Set Up
To establish an initial baseline and calibration waveform, the WAVEGEN was set as follows:
WAVEFORM: Sinewave
FREQUENCY: 60 Hz
AMPLITUDE: 2.5 V(rms) or 7.07 V(pp)
OUTPUT LOAD: 50 Ω (nominal)
With the IET substitution box set to 50 Ω and the DMM set to “Ohms” mode, the DMM measured 50.15 Ω inclusive of connecting cables, or 0.3% error from an ideal 50 Ω target (Figure 2). Reconfiguring the DMM to “Current (A)” mode and inserting it inline between the WAVEGEN output and the IET substitution box, the WAVEGEN output voltage was adjusted in fine increments until the current measured exactly 0.0500 A @ 60 Hz (Figure 3). These measurements confirmed a precise 0.0500 A(rms) current loop as a test reference.
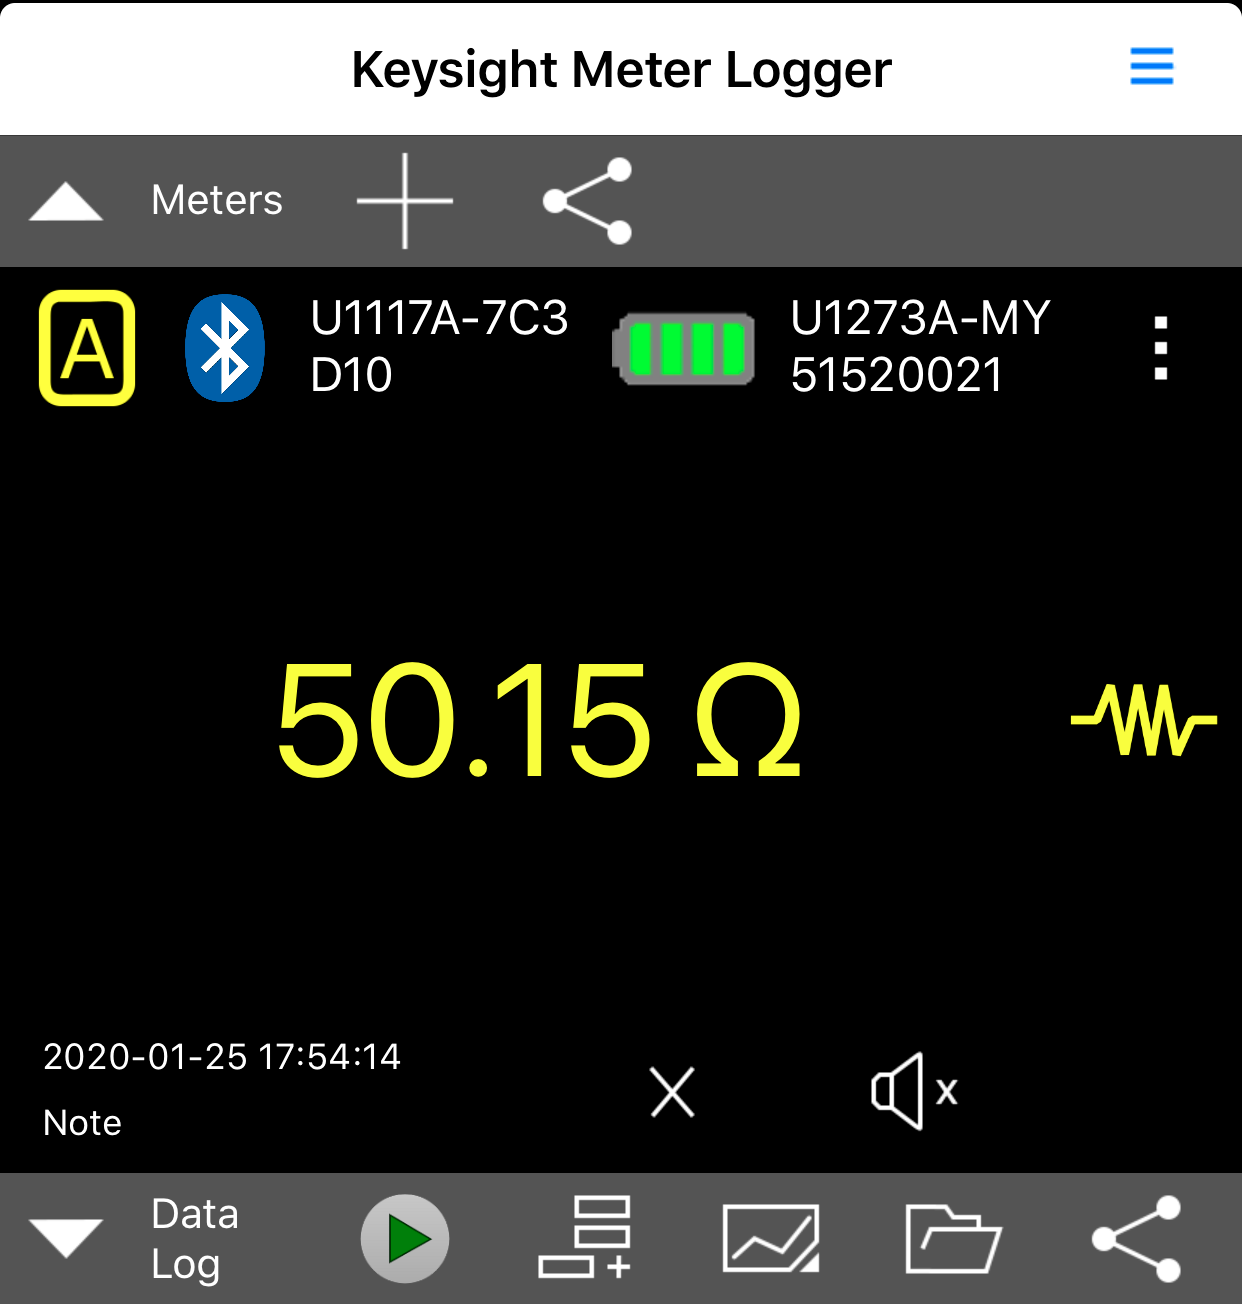
Figure 2. IET® RCS-500 R-C substitution box (set to 50 Ohms). Total resistance includes external cables.

Figure 3. Current loop adjusted to 0.05 A (50 mA).
DUT MEASUREMENTS
Prior to conducting swept-frequency measurements, BUILDERA measured the current on the Fluke Clamp meter and compared it to the known 0.0500 A(rms) test current. As Figure 1 shows, the clamp meter (in Amps range) measured 0.050 A(rms), which correlated identically to the inline current measurement. This provided the necessary confidence that the clamp meter was accurately calibrated to reflect the current passing through the clamp.
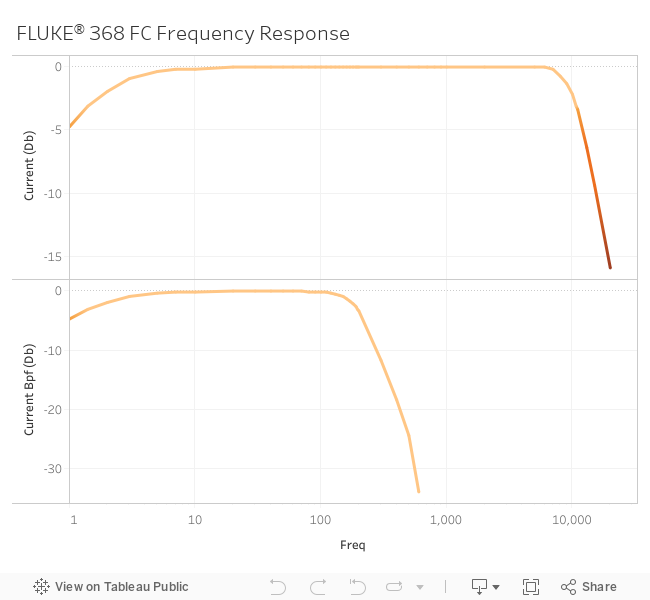
The specified frequency response of the FLUKE® 368 FC is 40 Hz to 1 kHz without the bandpass filter (“BPF”) enabled. When enabled, the BPF improves immunity from higher-frequency harmonics and noise, limiting the fundamental frequency range to 40 Hz to 70 Hz.
What Do The Measurements Show?
With the BPF disabled, the meter began to drop off measurably below 20 Hz, with a - 3dB point of approximately 1.4 Hz. The high frequency remained intact until well beyond 1 kHz, with a -3dB point of 10,700 Hz. Note that complex waveforms (other than purely sinusoidal) will have higher-order harmonics, thus the 1 kHz specification appears to be very conservative in order to allow higher-order harmonics from passing without compromise.
With the BPF enabled, the low frequency response was identical. Apparently, the BPF relies on the existing device rolloff at the low frequencies. At higher frequencies, however, the filter begins to roll off between 70 Hz and 80 Hz, reaching the -3dB point at 195 Hz. This filter rolls off faster after the 3dB point.
About BENCHNOTES
BENCHNOTES provide useful insights and tips discovered in the daily engineering and investigation process at BUILDERA. By sharing these findings online or in downloadable PDF format, engineers and consumers benefit from the exploration. BENCHNOTES are informal reports, often with raw, unaudited data.